If you think that technical analysis is a bunch of nonsense, look here. Fighting is underway in Europe. At the same time, oil is getting cheaper. Modern warfare is very greedy for fuel. This manifested itself during World War II.
During that period of time, 14 factories were operating in Germany to produce artificial hydrocarbon fuels. Although the fuel produced by such a plant is 3-4 times more expensive than gasoline produced by an oil refinery. There was not enough oil.
Technical analysis of the situation
What do we have right now? Falling oil prices. It doesn’t make sense! Of course, it can be said that armies of millions of soldiers do not move across the continent and so much fuel is not required now. In addition, a fundamental analyst may say that the market is pricing in a possible conflict freeze. But all this is just talk. Now look how technical analysis answers this question. Here is a logarithmic price chart of Brent. The timeframe is Monthly.
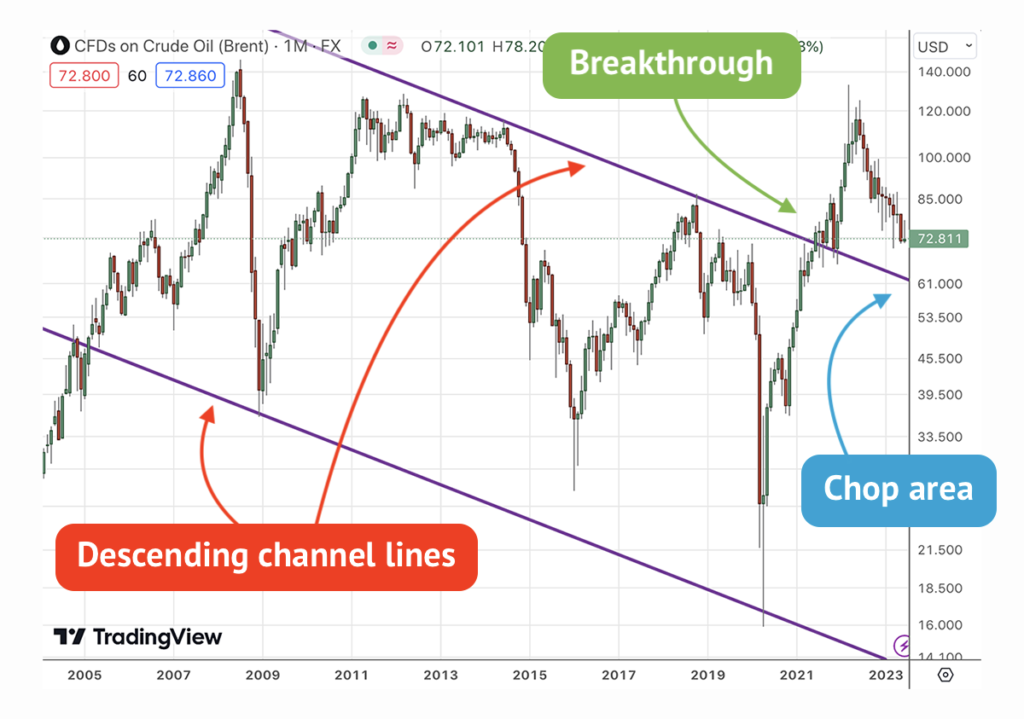
We’ve drawn a descending channel. The price moves to the chop area after the breaktrough of the channel. Highly likely, the oil price will continue to fall and come to $60. You can receive it at this level. At this level there will be a struggle. But that is another story.
Breakthrough trading
Breakthrough trading, also known as breakout trading, is a popular trading strategy used in financial markets. It involves taking positions in anticipation of a significant price movement when an asset’s price breaks through a defined level of support or resistance.
The basic premise of breakthrough trading is that when an asset’s price breaks through a key level of support or resistance, it signifies a shift in market sentiment and the potential for a strong and sustained price movement in the same direction. Traders who employ this strategy aim to capitalize on these breakout movements and profit from the subsequent price trends.
How breakthrough trading works
Identifying the breakout level
Traders typically identify key levels of support and resistance on a price chart. Support refers to a level where buying interest is expected to outweigh selling pressure, causing prices to bounce back up. Resistance, on the other hand, is a level where selling pressure is expected to overpower buying interest, leading to price declines. Traders look for a breakout above resistance or below support as potential entry points.
Confirmation
Traders usually wait for confirmation before entering a trade. They seek confirmation through various technical indicators, patterns, or volume analysis to validate the breakout and reduce the risk of false breakouts.
Entry and stop-loss placement
Once the breakout is confirmed, traders enter the market by buying or selling the asset. They often place a stop-loss order below the breakout level to limit potential losses if the breakout fails or reverses.
Profit targets and risk management
Breakthrough traders typically set profit targets based on the anticipated magnitude of the breakout. They may also use trailing stop orders or other techniques to lock in profits as the price continues to move in their favor. Effective risk management is essential, and traders should carefully consider their risk-reward ratio and position sizing.
Technical analysis issues
Not all breakouts lead to sustained price trends, and false breakouts can occur. Therefore, traders should exercise caution and consider other technical analysis tools and market factors to increase the probability of successful breakout trades.
This is how technical analysis answers complex questions without any reasoning or guesswork.