False breakout trading is a popular strategy among traders looking to capitalize on market inefficiencies. While breakouts can signal the beginning of a strong move, false breakouts offer traders the chance to profit when the market fails to follow through. This article explores false breakouts, shows their features, and provides methods to trade effectively in such scenarios.
Table of contents
What is a false breakout?
How to identify false breakouts
Rapid price reversal after the breakout
Low trading volume on the breakout
Lack of follow-through
Presence of divergence in momentum indicators
Breakout occurs in a ranging or low-volatility market
Candlestick patterns around the breakout level
Why false breakout trading is promising
Higher risk-reward ratio
False breakout trading exploit market inefficiency
Why false breakout trading is tricky
Difficult to identify
High frequency of occurrence
Best financial instruments for false breakout trading
Forex
Futures (derivatives)
Commodities (Gold, oil)
How about stocks and indices?
How to reduce risk in false breakout trading
Use proper Stop Losses
Avoid over-leveraging
Wait for confirmation
How to trade this strategy right now
Perpetual EA for false breakout trading
Conclusion
My products in detail
What is a false breakout?
A breakout occurs when the price of a financial instrument moves beyond a critical level of support or resistance. However, not all breakouts lead to sustained price movement. A “false breakout” happens when the price moves beyond these levels but fails to hold and reverses direction, trapping traders who entered in the direction of the breakout.
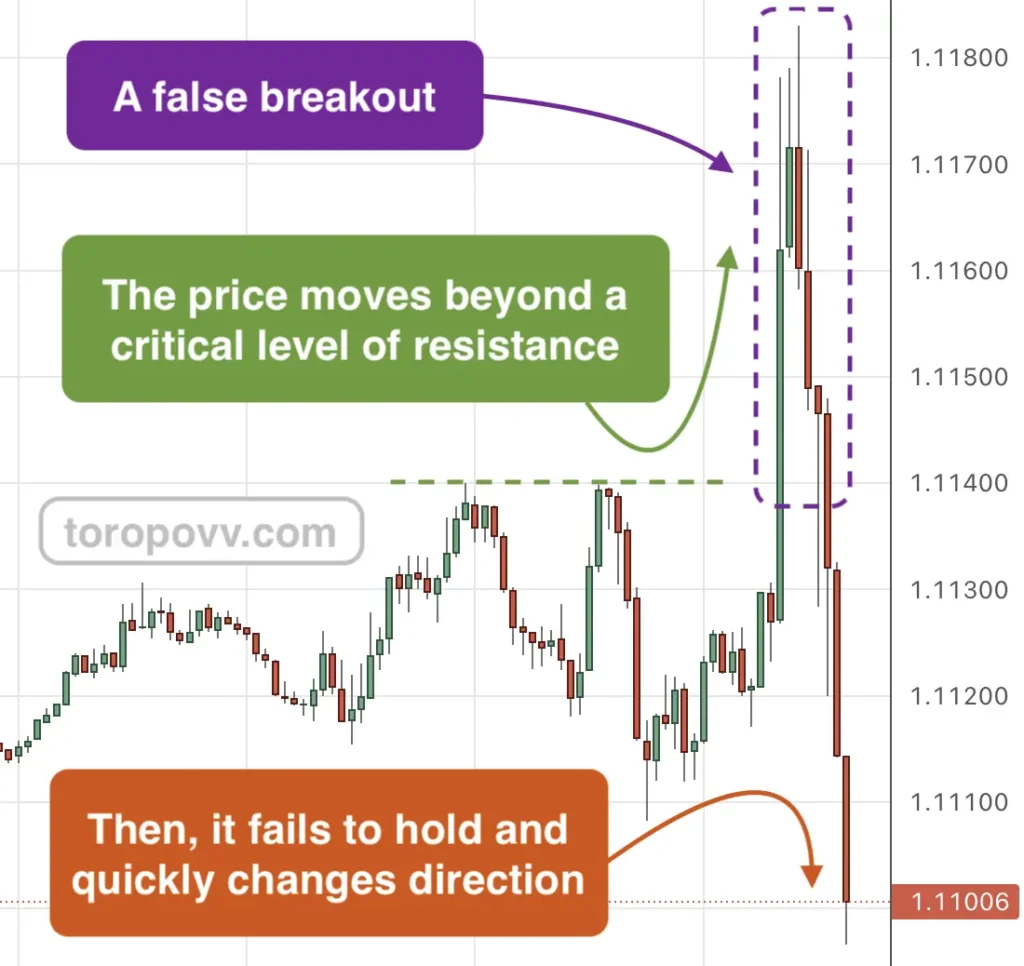
You can see in the picture above how this most often happens. Savvy traders can capitalize on this price reversal by taking positions contrary to the initial breakout.
How to identify false breakouts
Recognizing false breakouts is critical for traders, as trading them incorrectly can lead to significant losses. This chapter explores the key characteristics of false breakouts so you can better identify them in your trading.
Rapid price reversal after the breakout
A hallmark of a false breakout is the speed at which the price reverts to its original range. When a genuine breakout occurs, price action often continues in the breakout direction with momentum. However, in a false breakout, price movement past the key level is often short-lived. For example, if a currency pair breaks above a resistance level but quickly drops back below it, this can indicate a false breakout.
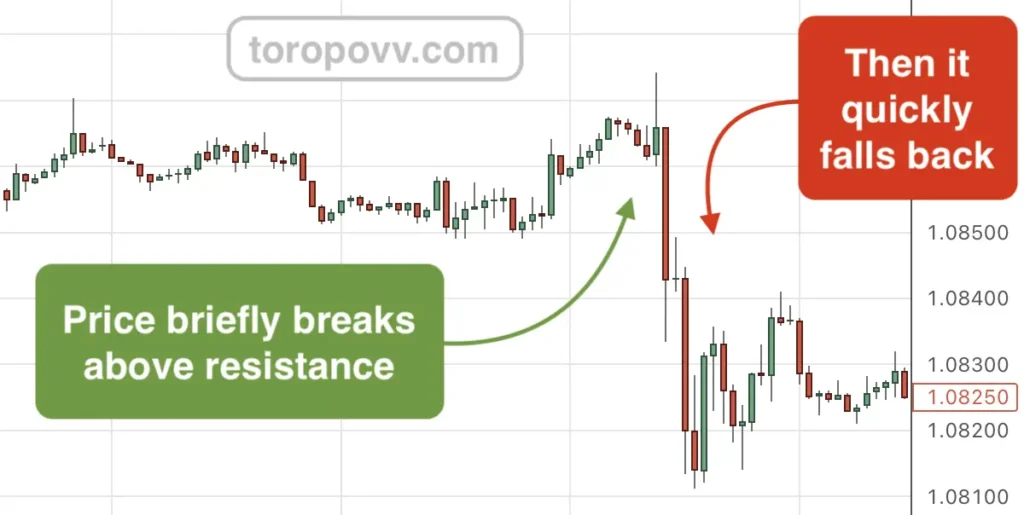
Key feature:
Pay close attention to the price behavior immediately after it crosses a level. If there is an immediate reversal or consolidation back within the previous range, it may be a sign of a false breakout.
Low trading volume on the breakout
Volume can provide valuable insights into the strength of a breakout. In a legitimate breakout, high trading volume usually accompanies the price movement, indicating strong market interest in the new trend direction. Conversely, false breakouts are often accompanied by low trading volume, suggesting a lack of conviction among traders.
Key feature:
Use a volume indicator to assess the level of market interest when the price breaks a level. If volume is low, it might be best to open a position against the price movement.
Lack of follow-through
In a successful breakout, follow-through is key – the price should continue moving in the breakout direction, establishing higher highs (in the case of a bullish breakout) or lower lows (in a bearish breakout). However, with false breakouts, the price often fails to make significant progress after the initial move. For instance, a false bullish breakout may fail to establish a higher high, instead falling back toward or below the previous resistance level.
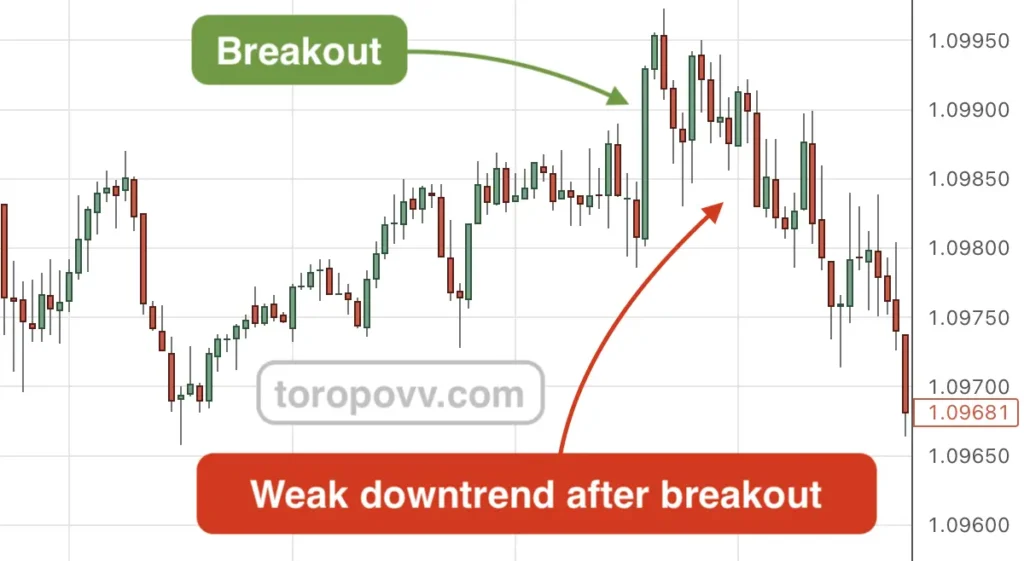
Key feature:
If a breakout occurs but the price quickly loses momentum and fails to extend beyond the breakout level, this may signal a false breakout. Monitor the price action after the breakout for signs of continuation.
Presence of divergence in momentum indicators
Divergence occurs when the price moves in one direction, but a momentum indicator, such as the Relative Strength Index (RSI) or Moving Average Convergence Divergence (MACD), moves in the opposite direction. This discrepancy often suggests that the breakout may lack the underlying momentum required to sustain the movement. For example, if the price rises above a resistance level but the RSI or MACD is trending downward in a bullish breakout, it can signal a potential false breakout.
Key feature:
Check for divergence between price and momentum indicators before trading a breakout. If a divergence exists, exercise caution, as it could indicate a lack of momentum behind the move.
Breakout occurs in a ranging or low-volatility market
False breakouts are more common in ranging or low-volatility markets, where prices oscillate within a narrow range and lack strong directional trends. In these conditions, breakouts are less likely to have follow-through, as the market doesn’t have the momentum needed to sustain a breakout.
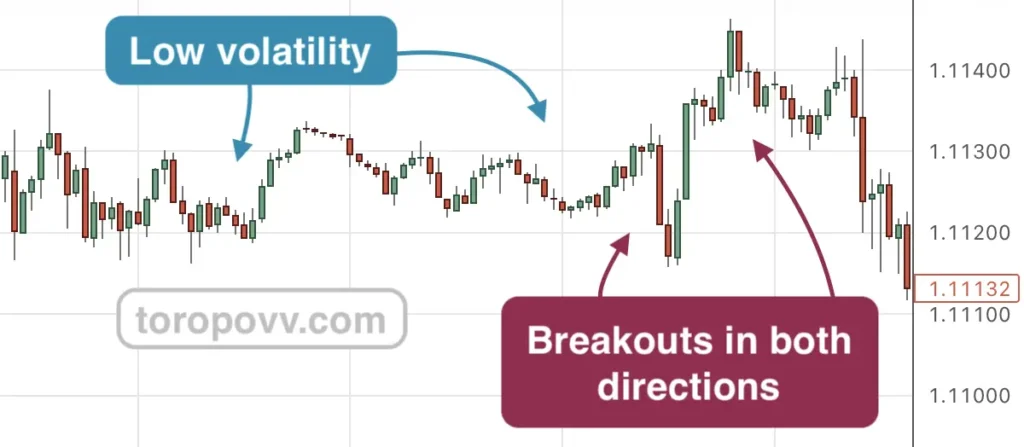
Key feature:
Look for breakouts in low-volatility environments. In a range-bound market, prices are more likely to bounce back into the range than to establish a sustained trend.
Candlestick patterns around the breakout level
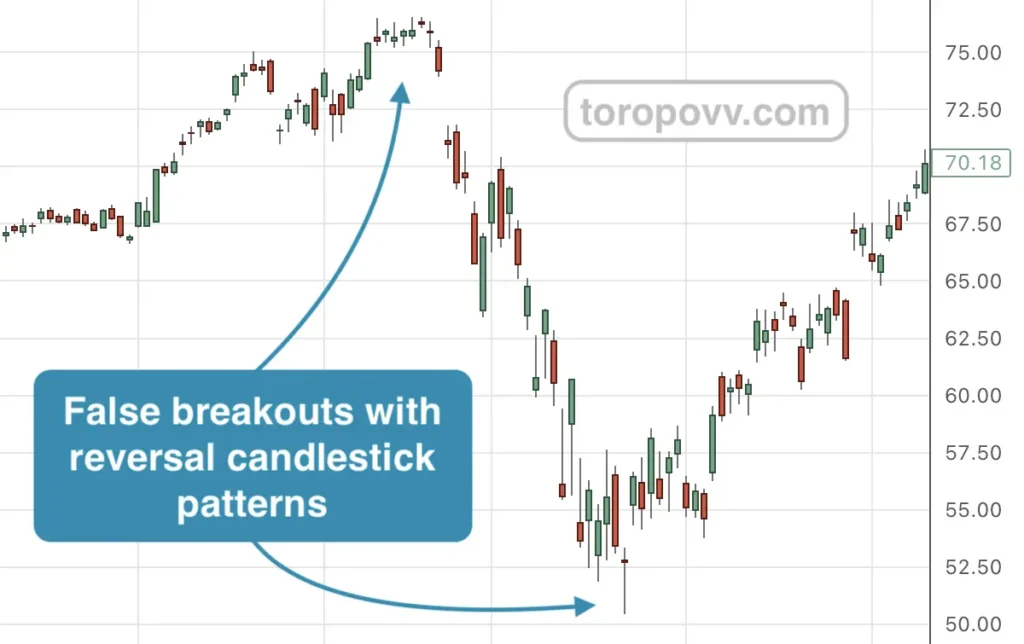
Specific candlestick patterns can help traders identify false breakouts. For example, patterns like the shooting star, bearish engulfing, doji near resistance, or hammer and bullish engulfing near support, can indicate indecision or a lack of commitment among traders at the breakout level. These patterns often signal that the breakout may not hold, and a reversal is possible.
Key feature:
Look for reversal candlestick patterns near the breakout level, as they may indicate hesitation and a potential for the price to return to the previous range.
Why false breakout trading is promising
False breakout trading suggests higher risk-reward ratio
False breakout strategies offer traders the opportunity to enter trades with tighter stop losses, allowing for a better risk-reward ratio. Since false breakouts often lead to significant reversals, even a small risk can yield substantial gains.
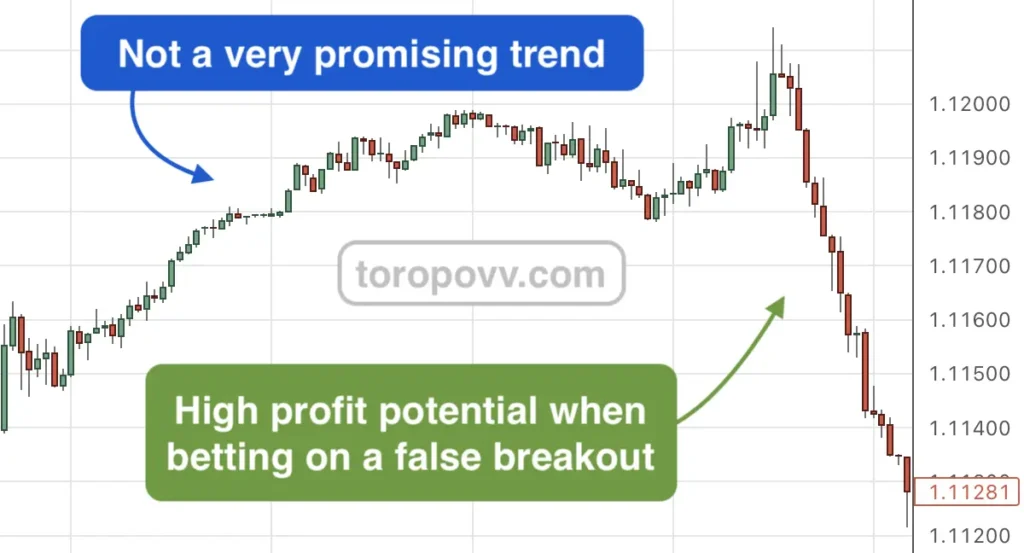
In addition, false breakouts often create well-defined support or resistance levels. Traders can easily identify trade entry points and clear targets for taking profits, which enhances the risk-reward ratio.
False breakout trading exploit market inefficiency
False breakouts are notorious for trapping inexperienced traders who enter trades when they see a breakout. As the price reverses, those trapped traders are forced to exit, creating momentum for the false breakout trader.
This method exploits market inefficiencies. When many traders are caught on the wrong side of the trade, the reversal tends to be swift and profitable for those who anticipated it.
Why false breakout trading is tricky
Difficult to identify
Accurately spotting a false breakout can be challenging. It requires experience, a keen understanding of price action, and sometimes the use of additional indicators, like volume, to filter false breakouts from real ones. Typically, false breakouts have underlying reasons. Therefore, the comprehension of them comes from trading experience.
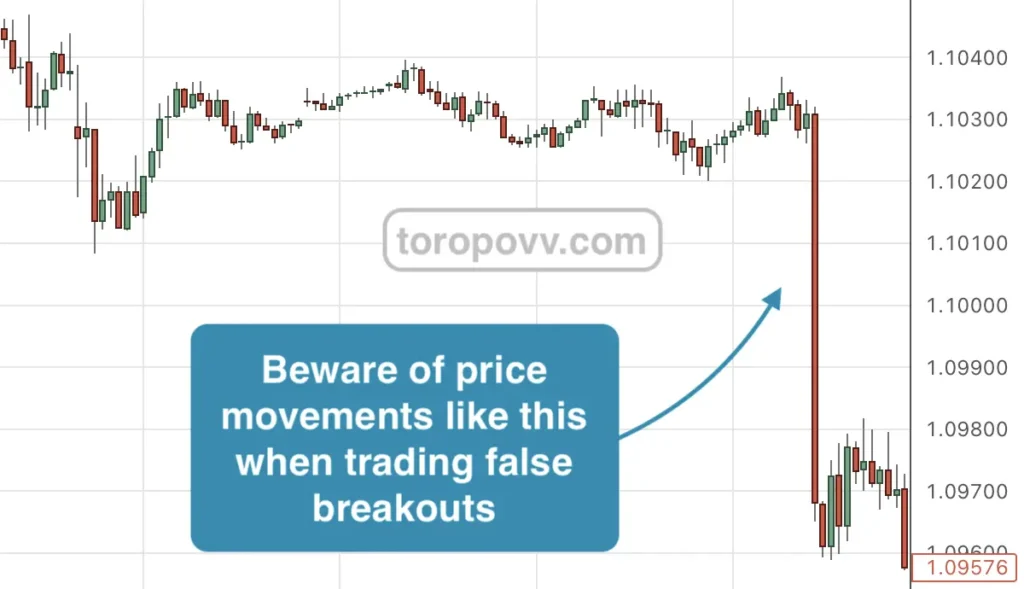
Going against the market trend, especially during a breakout, can be psychologically difficult. Traders may doubt their decisions, especially if the breakout appears convincing at first. Since false breakouts can be the result of manipulation, there’s always the risk of being outmaneuvered by larger market participants who can push the price in unpredictable ways.
High frequency of occurrence
False breakouts occur more frequently than regular breakouts. However, not every false breakout leads to a rapid reversal. As a result, traders relying on this strategy must remain patient, as suitable opportunities may only come up sometimes.
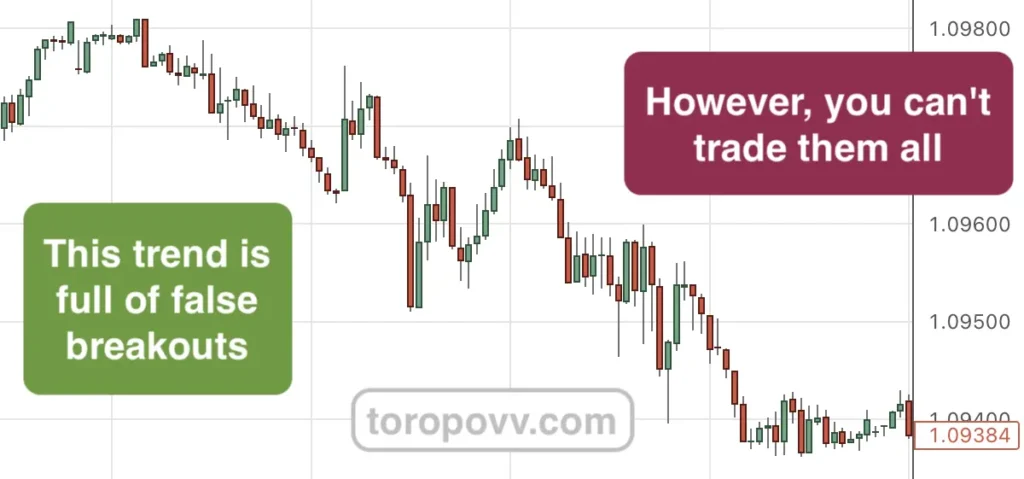
In addition, several repeated false breakouts can also become a trend. Needless to say, this type of trend does not provide a chance to earn on false breakouts.
Best financial instruments for false breakout trading
While false breakout trading can be applied to various financial instruments, some markets are more prone to false breakouts due to their high volatility and frequent testing of key levels. Here are a few common instruments:
Forex is the best choice for false breakout trading
The forex market is one of the most popular markets for false breakout strategies due to its liquidity and frequent testing of support and resistance levels. Currency pairs like EUR/USD, GBP/USD, and USD/JPY often experience false breakouts, providing ample opportunities for traders.
Futures (derivatives)
Futures contracts are suitable for false breakout trading because they require low commissions for opening and closing positions. In general, futures are the best choice if you trade the stock market. The thing is that a derivative usually repeats the price movements of the underlying asset, although futures are much cheaper to speculate.

Of course, futures trading has features related to their behavior during a dividend gap and the time limitation of the contract. Despite this, low commissions outweigh all the disadvantages.
Commodities (Gold, oil)
Commodities like gold and oil often experience false breakouts due to geopolitical events, supply-demand imbalances, or speculation. These markets are ideal for false breakout strategies, particularly when key levels are tested.
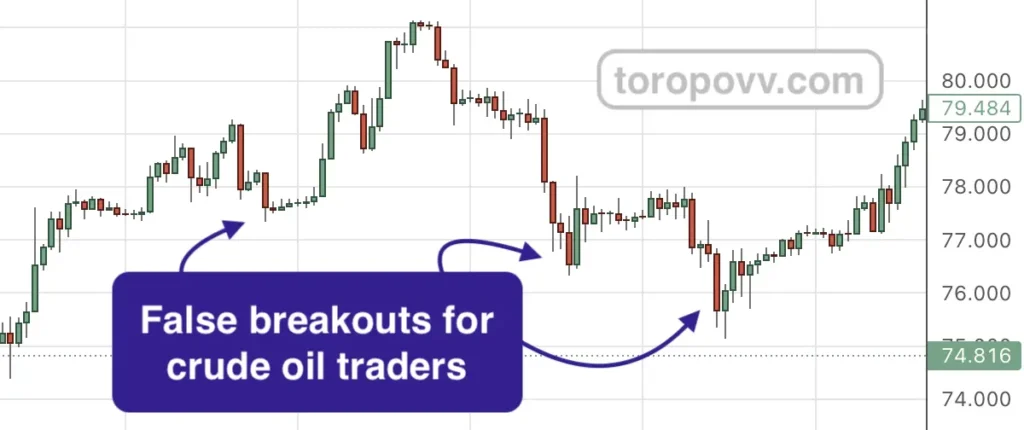
Again, you need a broker with low trading fees to trade these instruments successfully.
How about stocks and indices for false breakout trading?
False breakouts can occur in individual stocks, especially in small-cap stocks where price manipulation by large players can create fake breakouts. However, stocks that trade in wide ranges before breaking out are prime candidates for this strategy. Stock market indices also tend to show false breakouts during consolidation periods. This is especially true when market sentiment is uncertain and price levels fluctuate around support or resistance lines.
However, the high trading fees of these financial instruments make short-term trading costly. Despite this, it is essential to understand that false breakouts occur not only in intraday trading. False breakouts occur across different trading horizons, from daily charts to weekly or monthly timeframes.
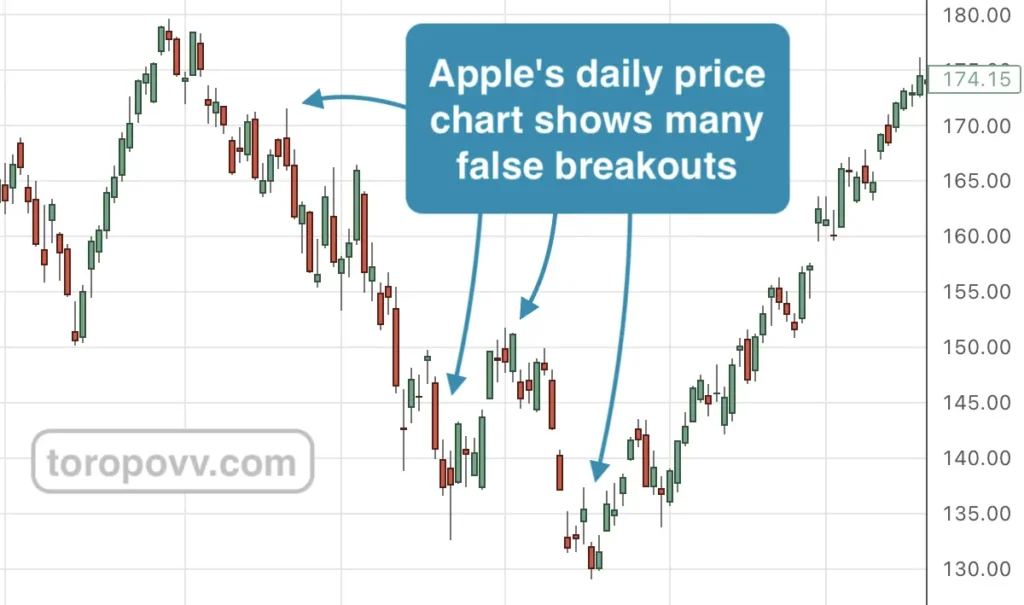
You can adapt this strategy to fit your style and timeframe. For example, this method can be very profitable when trading stocks or indices on daily charts. In this case, relatively high trading fees do not matter.
How to reduce risk in false breakout trading
Risk management is crucial for false breakout traders, as the market can be highly volatile around key levels. Here are a few risk management tips:
Use proper Stop Losses
It seems traders should use tight stop losses just above the breakout level when trading this strategy. This way, losses are minimized if the breakout proves to be real. But don’t rush to do so. Setting Stop Losses is naturally a complex science. That’s why giving any general advice on this matter is so difficult.
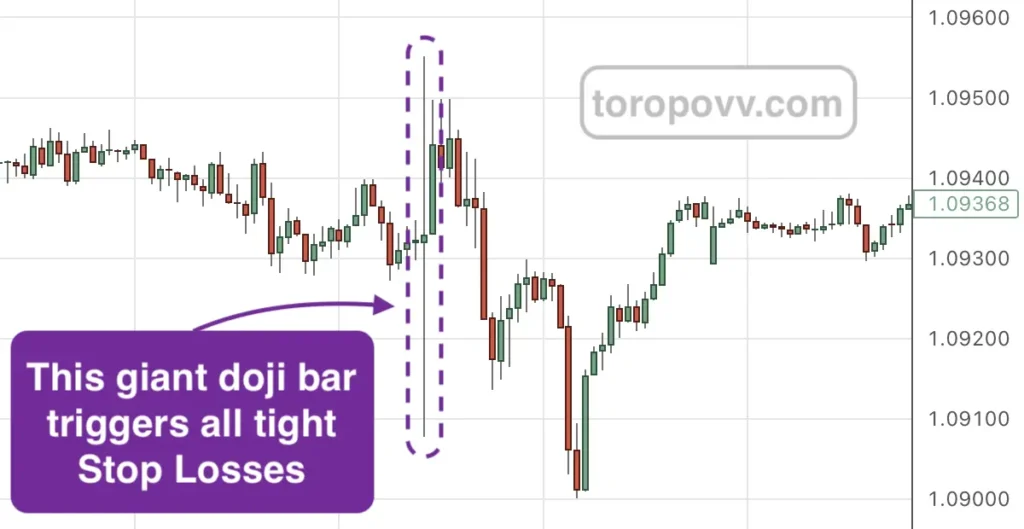
In any case, the size of your Stop Loss should be compatible with the current market volatility. This is much more important than all other factors.
Avoid over-leveraging
False breakout trading requires precision and patience. Over-leveraging can lead to significant losses if the trade goes against you, so it’s crucial to maintain appropriate position sizing.
Of course, false breakout trading typically involves using leverage. That’s why you should limit your leverage use. Choose a leverage level that aligns with your risk tolerance and trading method. Many traders recommend using no more than 2:1 or 3:1 leverage for higher safety.
When you over-leverage, even a tiny adverse price movement can lead to substantial losses, potentially quickly wiping out your trading capital. Moreover, if a trade goes against you, you might face margin calls, forcing you to deposit more funds or close positions at a loss.
Wait for confirmation
Instead of jumping in at the first sign of a reversal, wait for additional confirmation like a retest of the breakout level, volume analysis, or divergence with momentum indicators.
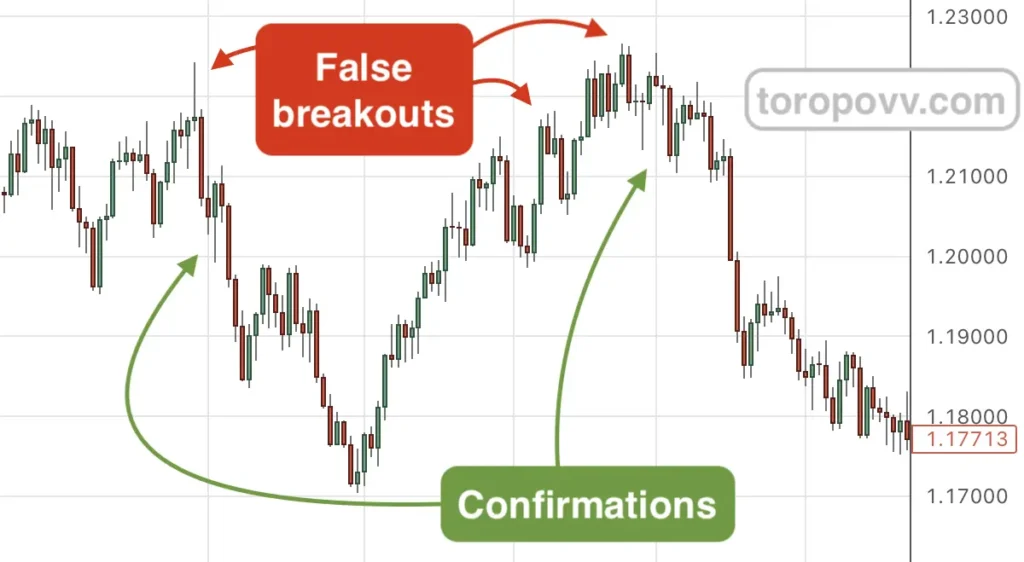
Naturally, waiting for confirmation worsens the price of opening a position and reduces potential profit. But it also reduces the number of losing trades. Therefore, confirmation is worth it.
You can trade this strategy right now!
If you like this strategy and think it is one of the best trading strategies and should be applied in practice as soon as possible, then you are absolutely right! I want to make you happy because I have already created a trading robot that implements this strategy.
Perpetual EA
Read more about the trading robot for false breakout trading. You can download and test it for free.
Conclusion
False breakout trading can be a highly profitable strategy for those who master it, offering superior risk-reward opportunities and trapping inexperienced traders on the wrong side of the trade. However, the strategy comes with its own set of challenges, including the difficulty of identifying false breakouts and the psychological strain of going against the trend.
By focusing on markets with high volatility, understanding key indicators, and employing strict risk management, traders can effectively navigate the risks and rewards of this method. Whether you’re trading forex, stocks, commodities, or indices, the false breakout strategy remains a valuable tool in a trader’s arsenal.
Luckily, my products already do all this automatically. These are reliable trading algorithms that do not get tired and do not make mistakes in their calculations. Try them for free. Happy trading!
My products in detail
Learn more about all my products for traders and unlock the potential of automated trading!


